Authors: García-Meléndez, E.*, Espín de Gea, A.**, Ferrer-Julià, M. *, López, E. **, Cruz, J.A. *, Carreño, F. **, Rodríguez, I. *, Valenzuela, P., Reyes, M. **, Colmenero Hidalgo, E. *, Coronado, I. *,
*Environmental Geology, Quaternary and Geodiversity Research Group (Q-GEO), Faculty of Biological and Environmental Sciences. University of León. León
**Geological-Mining Technological Unit of the Marble, Stone and Materials Technological Centre (CTM).
In this work, hyperspectral images acquired with terrestrial sensors are used in a novel application at international level that lies in real-time experimentation in the production process in quarries and ornamental carbonate rock factories in order to locate and map the mineral composition of vertical quarry faces, blocks, slabs, cut rock slabs, etc. using imaging spectroscopy techniques. This cutting-edge technology based on proximity remote sensing will improve the selection and classification of useful material in the quarry, avoiding the transport of large pieces to the cutting sheds that would ultimately be rejected, generating unnecessary waste, thus improving the efficiency of the quarry and improving the compositional characterisation of the material to contribute to more efficient and sustainable extraction. One of the benefits will be the evaluation and implementation of new environmentally sensitive mining techniques available to companies that will help to achieve and secure a sustainable supply of raw materials to the European economy, increasing the benefits for society as a whole.
The selection of the type of rock for a given use is basic to any project in which it is to be used (construction, etc.), as there is no such thing as a bad rock, only a badly used one. Ornamental rock may have characteristics that mean that, for example, it cannot be marketed in a given country, that it cannot be used outdoors but can be used indoors, or that it is better suited to a wet or dry climate. For this reason, the regulations require an initial analysis of the physical and chemical characteristics of the material. However, the intrinsic spatial variations of this natural product make it difficult to maintain, at times, the uniformity of specific characteristics throughout the exploitation of the resource due to the heterogeneity of natural products.
The University of León and the Technological Centre of Marble, Stone and Materials (CTM), through the HYPOPROCKS project financed with European funds through the Ministry of Science, Innovation and Universities, propose to improve the exploitation of quarries through the application of remote sensing proximal sensor technology (image spectrometry, or hyperspectral imaging). This technology is similar to that used by satellite remote sensors, also applying the same analysis methods, but, in this case, it works with images obtained at close range in the field, laboratory and drones. In this way, the mineralogical characteristics of the different quarry faces that appear throughout the exploitation period are monitored. Specifically, the project focuses on a mineral resource context that includes limestone, marble and dolomite, both for ornamental and other uses. All of them are carbonates, which means that they share spectral characteristics that allow a comprehensive approach using this technology. In industry, carbonate rocks are one of the essential materials used in many sectors, such as ornamental rocks, construction, in the cement industry or in the agricultural industry, and represent 50.44 % of the employability in the Spanish mining sector (according to the report ‘Estadística Minera 2019’ of the Secretary of State for Energy). However, the observations were also extended additionally to other ornamental rocks such as granitic rocks, with samples provided by the INGEMAR business group. The aforementioned project is related to the State Plan for R&D&I oriented to the Challenges of Society, in the challenge ‘action on climate change and efficiency in the use of resources and raw materials’, thematic priority ‘efficiency in the use of resources and raw materials’. It also corresponds to the challenge of the Horizon Europe Research Framework related to raw materials, especially non-energy and non-agricultural raw materials.
What is hyperspectral imaging?
Imaging spectrometry, also known as hyperspectral imaging (HSI) or imaging spectroscopy, is the simultaneous measurement of spectra (or spectral curves) by storing these data in image format. Each of these spectra shows the behaviour of electromagnetic energy as it strikes the material under study. The amount of reflected energy varies with wavelength and is recorded in hundreds of channels or spectral bands corresponding to different wavelengths (Figure 1). Analysis of the data from an imaging spectrometer allows a detailed spectrum to be extracted for each element or pixel in the image (Figure 2). The greater the number of bands or, in other words, the higher the spectral resolution of the image, the more detailed the spectral curve stored in each pixel, the greater the number of points, resulting in a more defined continuous spectrum.
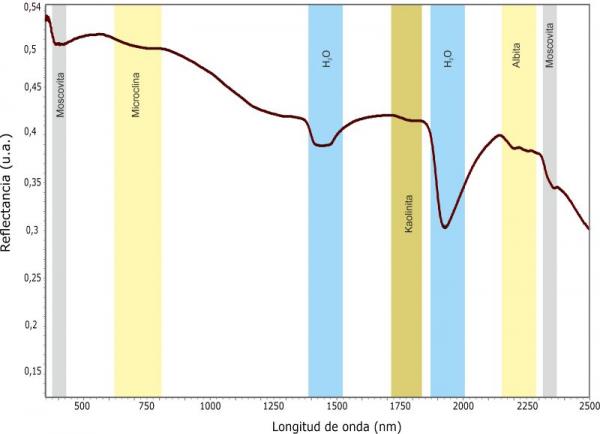
Figure 1. Example of a spectral curve or signature of a granite sample provided by the INGEMAR group. It shows features indicative of a composition associated with a felsic plutonic igneous felsic rock, such as feldspars (microcline and albite) and micas (muscovite). But there is also an incipient feature of kaolinite, as a response to the most frequent alteration processes that granites can undergo, such as kaolinitisation (chemical weathering by hydrolysis).

Figure 2. Generation of spectral curves or signatures of pixels forming a hyperspectral image, corresponding to a carbonate rock called Imperial Brown.
In this way, this technology allows the identification of minerals based on their reflectance or emissivity signatures (Goetz et al., 1985), facilitating the mapping of spectrally active materials on the Earth's surface remotely, or of vertical outcrop surfaces of quarry walls and even slabs and hand samples in the laboratory. In the case of a slab from a block or quarry face, the analysis of each spectrum provides the mineralogical composition of the main mineralogical components and, in some cases, the quantification of each mineral phase, which means that the mineralogical composition of the quarry wall or slab of a block can be mapped from a hyperspectral image (Figure 3).

(a)
(b)
.jpg)
(c)
(d)
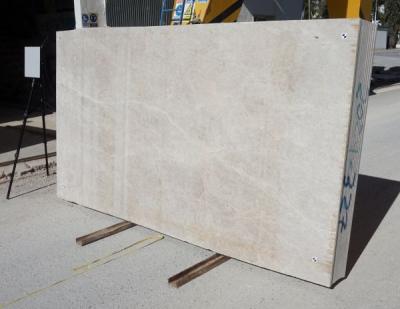
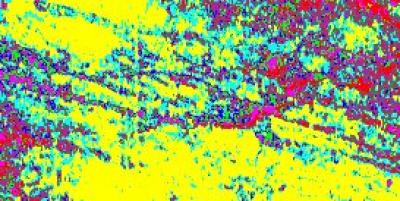
Figure 3. (a) Process of capturing a hyperspectral image in a marble factory. (b) Slab cut from a quarried block. (c) Hyperspectral image displayed as a colour composite. (d) Supervised classification result applying the SAM (Spectral Angle Mapper Classification) algorithm to the spectrum band 2040 - 2500 nm (carbonate rocks), using spectra obtained in the laboratory.
What characteristics of minerals influence their spectral curves?
For wavelengths in the visible and near-infrared (VNIR) range, the reflectance spectra of minerals are dominated by the presence or absence of transition metal ions (such as Fe, Cr, Co, Ni). These ions absorb energy in this region by electronic processes and are reflected as absorption features in the spectral curve. On the other hand, the presence or absence of water and hydroxyl, carbonate and sulphate ions determines absorption features at wavelengths corresponding to the short-wave infrared (SWIR) due to molecular vibrational processes. Thus, small differences in the position and shape of such absorption features in the VNIR-SWIR (or long-wave infrared emissivity - LWIR) are correlated with differences and variability in mineral composition. Thus, the spectral curves allow direct identification of iron minerals such as haematite, goethite, jarosite, etc. in the VNIR, of clays, carbonates, micas, sulphates and other minerals in the SWIR, and of silicates and carbonates in the LWIR. Figure 4 shows the variations observed in the spectral curve as a function of magnesium content in carbonate samples.

Figure 4. Spectral curves of different pixels of different mineralogical composition; red shows the main feature of dolomite (2315 nm) and calcite (2335 nm); reference spectral curves (dolomite lib and calcite lib) extracted from Kokaly et al. (2017).
In the case of carbonate rocks the main mineralogical compositions are minerals composed of calcite (calcium carbonate - CaCO3), and dolomite (calcium magnesium carbonate- CaMg(CO3)2). The technique of laboratory reflectance spectroscopy, based on spectral shapes and signal characteristics, has been used intensively for many decades to determine the mineral chemistry and composition of carbonate rocks. The diagnostic absorption characteristics of carbonate minerals in the SWIR (shortwave infrared) region are determined by the vibrational processes of carbonate ions (CO32-). These minerals exhibit two distinctive spectral absorption features, whose positions are centred between 2.50-2.55 μm and 2.30-2.35 μm in the SWIR region (Hunt & Salisbury, 1971; Zaini et al., 2014, among others).
How are images analysed?
There are spectral libraries or spectro libraries that store the spectral curves of different types of materials of known composition: rocks, soil types, minerals, vegetation, ... These libraries are of great help in identifying what each of the spectral curves we can extract from the pixels of a hyperspectral image corresponds to. In the field of geology, the two best known libraries are those of the United States Geological Survey (USGS) and the Jet Propulsion Laboratory (JPL). Comparing the spectra of each pixel with these curves is undoubtedly the first step to take, but it is often not enough. Two samples of the same mineral can have some compositional variability, which produces variations in their spectral curve.
In addition, a pixel collects reflectance information from an area (from a quarry face, from the surface of a sample, from the earth's surface, ...), so the spectrum of each pixel is the mixture of the spectral response of all the components existing in the analysed area. In many cases, two different minerals appearing in the same sample present two absorption features at very similar wavelengths, making their identification difficult. In other cases, the co-existence of two minerals in the same sample can lead to an absorption feature that in the bibliography serves as a reference for its diagnosis appearing displaced in the spectral curve, that is, appearing at another wavelength, making its identification difficult.
For this reason, it is advisable to generate your own spectral libraries with samples from the study areas where you are working, such as those obtained in the HYPOPROCKS project. The set of these spectral curves feeds machine learning algorithms facilitating the mineralogical identification, allowing to determine the absence/presence of minerals. The advances being seen in Artificial Intelligence are expected to provide substantial improvements in the coming years.
Advantages of the use of this technique in the ornamental rock world
In the field of quarrying, the advantages of this technique are the possibility of carrying out on-site analysis, the fact that sample preparation is no longer necessary and its speed, as the existence or absence of certain mineral compounds can be identified in less than 24 hours. These three characteristics make this technique ideal for the continuous monitoring of quarry faces, improving the selection of areas to be exploited and reducing the volume of waste. In addition, in the cutting sheds, it also allows the different slabs to be classified according to their compositional quality.
Likewise, obtaining hyperspectral images from drones means a better economic use of waste from quarrying, by detecting the presence of certain minerals of possible interest in such waste. This knowledge opens up a wider range of potential uses for the waste, and those that provide the greatest economic benefit to the company can be chosen, while promoting a circular and sustainable economy.
Another field where the application of this technique is of interest is the management of the use of the material according to its quality. The analysis of hyperspectral images makes it possible to detect impurities in the rock, revealing that the block is unsuitable for installation, for example, in areas with rainy climates, outdoors, etc. In this way, greater customer satisfaction is obtained by improving the relationship between quality and use.
Synonyms
Imaging spectrometry, hyperspectral imaging (HSI), imaging spectroscopy
Spectral curve, spectral signature, spectra.
Spectral library, spectro library
Bibliography
Hunt, G.R. & Salisbury, J.W. (1971). Visible and near infrared spectra of minerals and rocks. II. Carbonates. Modern Geology, 2, 23-30.
Goetz, A.F.H., Vane, G., Solomon, J.E. & Rock, B.N. (1985). Imaging spectrometry for Earth remote sensing. Science, 228, 1147-1453.
Kokaly, R.F., Clark, R.N., Swayze, G.A., Livo, K.E., Hoefen, T.M., Pearson, N.C., Wise, R.A., Benzel, W.M., Lowers, H.A., Driscoll, R.L. y Klein, A.J. (2017). USGS Spectral Library Version 7: U.S. Geological Survey data series 1035, 61 p. https://doi.org/ghw2cg.
Zaini, N., van der Meer, F. & van der Werff, H. (2014). Determination of carbonate rock chemistry using laboratory-based hyperspectral imagery. Remote Sensing, 6(5), 4149-4172