Natural Stone Imports India 2024
The Indian fiscal year is from 1 April to 31 March. The stone imports figures for the fiscal year April 1 2024 to 31 March, 2025 show clear dominance of Turkey as the supplier of mostly blocks.
The Indian fiscal year is from 1 April to 31 March. The stone imports figures for the fiscal year April 1 2024 to 31 March, 2025 show clear dominance of Turkey as the supplier of mostly blocks.
Export Trend of Natural Stones & Products during 2021-2022
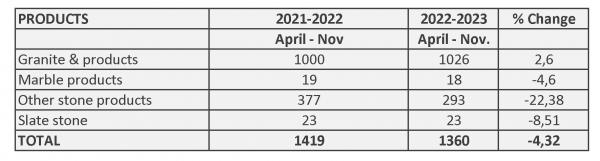
(Values in USD Million)
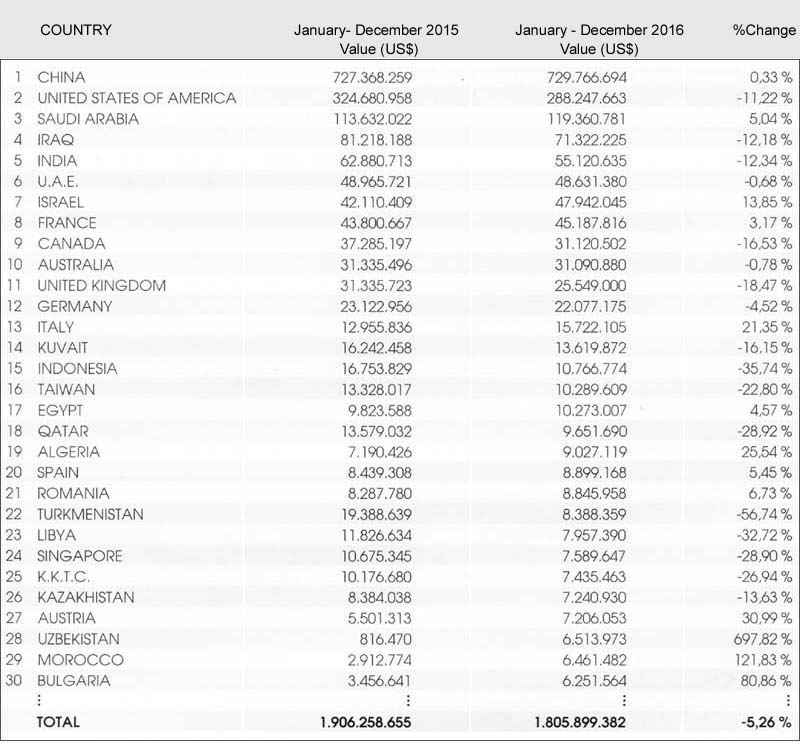
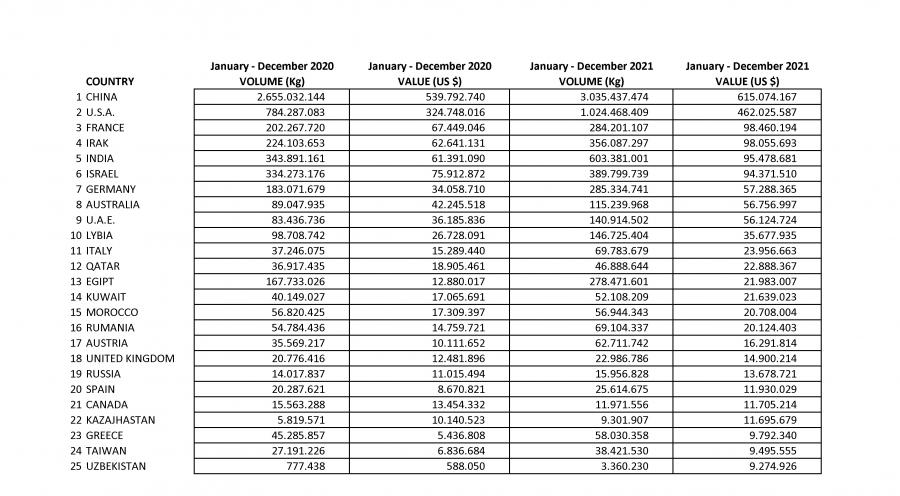
The export figures to the 25 most important destinations for natural stone from Turkey for the years 2020 and 2021 are the given in the table below.
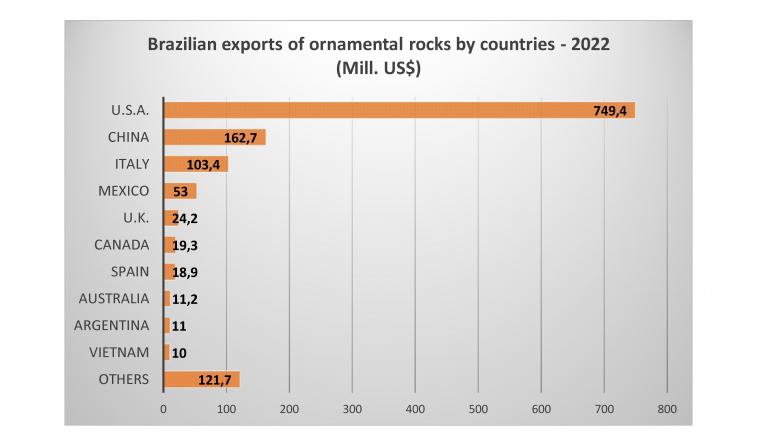
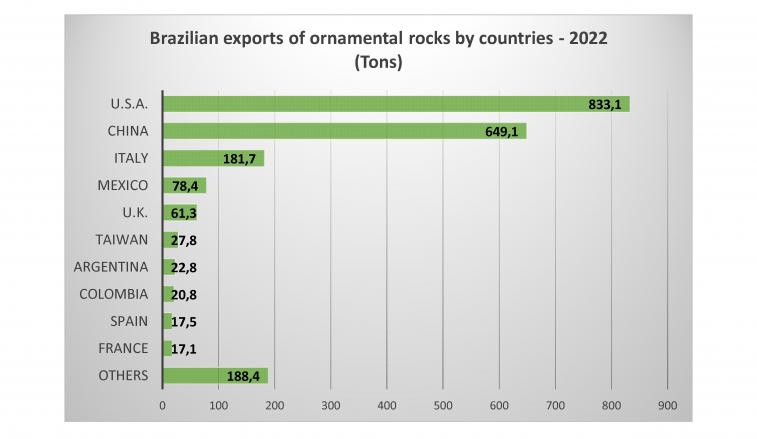
The exports of Brazilian natural stone exports in 2019 surpassed one billion US dollars (1.012.059.91) and, in quantity, reached the figure of 2153439.87 tons, which meant a positive variation of almost 2 % in sales and almost 2% decline in volume
Export statistics for the stone industry of Turkey for a particular year are one of the more reliable indicators of the state of the world stone industry, especially that of limestone and marble. The table below shows the country wide breakup of exports in 2019 for the twenty biggest markets and also the comparison with the year 2018.
The Brazilian exports of diverse comercial products of ornamental rocks reached 992.5 US$ million and 2.20 million tons in 2018, which meant a decline of 19.35% in turnover ando f 6.88% in volume with respect to 2017.
Export turnover
Exports of Brazilian ornamental rocks and diverse products amounted to US$ 1.107 billion and 2.36 million tons in 2017. These figures mean a 2.74% decline in turnover and a 4.10% decline in physical volume as compared to the year 2016. Processed stone accounted for 80.45% of the total in 2017, similar to the figure of 80.15% in 2016.
Average price
Turkish natural stone exports by countries